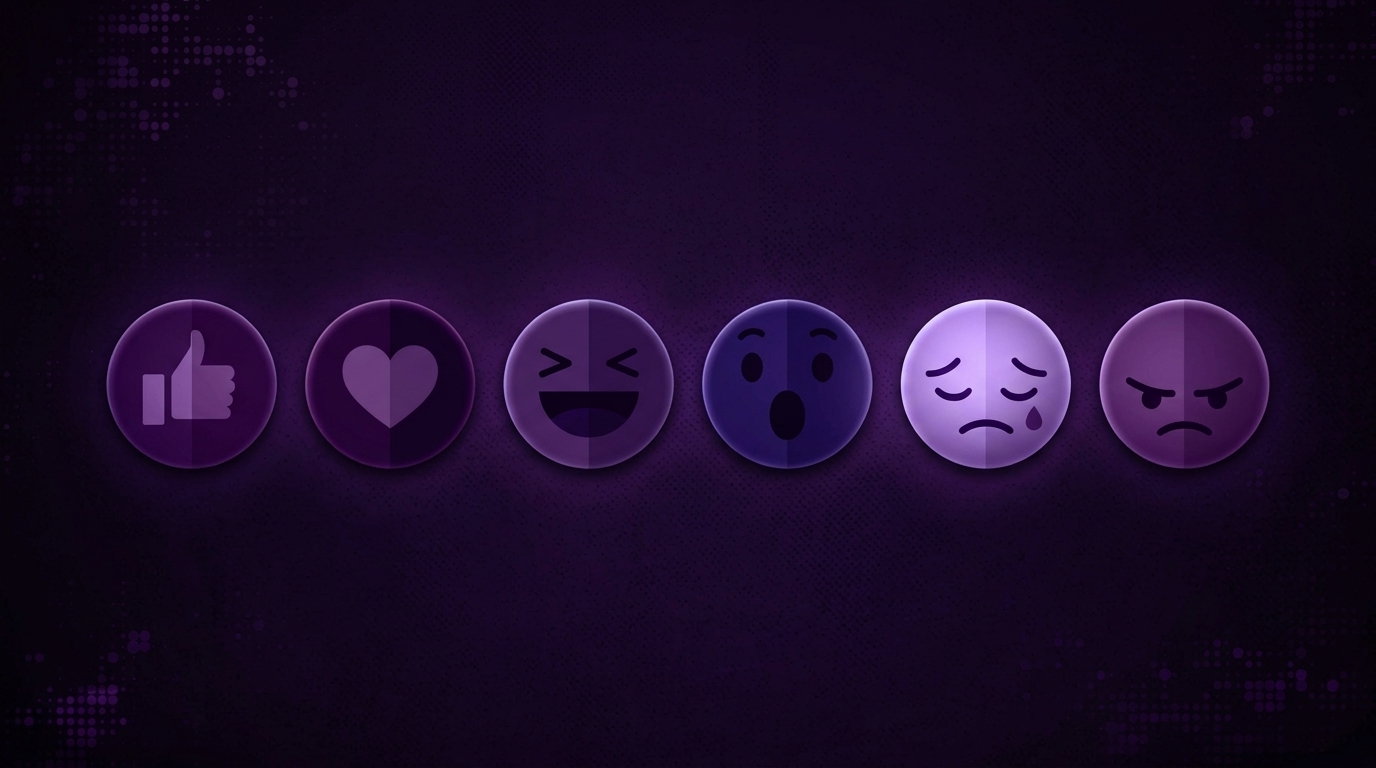
Six reaction buttons. Six very different meanings. Across a year of monitoring work, Capstone-Intel has tracked how each one actually shows up — and what it reveals that a raw engagement number never could.
Most social media reporting flattens every reaction into one number: total engagement. But a post with 10,000 Angry reactions and a post with 10,000 Love reactions aren’t the same result — they’re opposite outcomes wearing the same statistic. Across several of our own published studies, we’ve tracked how each reaction type actually clusters around a specific kind of public response. Here’s what the data shows, reaction by reaction.
For a deep dive on one reaction specifically, see why “Haha” reactions are a warning sign.
👍 LIKE — Baseline Acknowledgment
“Like” is the platform’s default, lowest-friction reaction — which makes it the hardest to read on its own. In our year-long monitoring of Facebook conversation around the House of Representatives, Like accounted for 33.09% of reactions, the second-most common after Haha. On its own, a high Like share generally signals simple acknowledgment or mild approval — it rarely indicates strong feeling in either direction. The more useful signal is almost always what a Like share is competing against.
❤️ LOVE — Genuine Admiration
Love is one of the clearest positive signals in the reaction set, and our data backs that up consistently. In our July 2026 Facebook monitoring report, posts about P-pop group SB19’s global music milestones generated a reaction mix that was 83.5% Love. A separate post — an ABS-CBN News anniversary feature on the West Philippine Sea arbitral victory — pulled 488,452 total reactions, 74.5% of them Love.
Two very different topics — a music group’s achievement and a national sovereignty milestone — but the same dominant reaction, because both triggered genuine pride and admiration rather than any kind of ambivalence. When Love dominates, it’s a strong indicator that content is landing exactly as intended.
😆 HAHA — Skepticism, Not Humor
This is the reaction most often misread, and the one our own research has focused on most directly. On entertainment content, Haha does mean humor. On institutional, economic, or government content, it almost never does.
- Flood control posts during SONA week: 58.2% Haha
- A single question about a ₱85 minimum wage adjustment — the highest-engagement post of July 2026, outperforming the entire SONA: 95.8% Haha
- A full year of Facebook conversation about the House of Representatives: 43.49% Haha, the single dominant reaction, ahead of Like
Three completely different contexts, one consistent pattern: when institutional or economic content skews heavily toward Haha, it’s public skepticism and mockery expressed the only way Facebook’s reaction set allows — not amusement. See our full breakdown of this pattern →
😮 WOW — Surprise, Underexplored in Our Own Data
Wow is designed to signal surprise or amazement, and it typically shows up around unexpected news, dramatic reveals, or content that breaks from an established narrative. We don’t yet have a headline Capstone-Intel data point isolating Wow the way we do for the other five reactions — it’s a genuine gap in our own published research so far, and a natural candidate for a future study specifically isolating breaking-news or announcement-driven content.
😢 SAD — Genuine Concern
Sad is a reaction we see far less often than Haha or Angry, which is part of what makes it meaningful when it appears. In our monitoring of online conversation about OFWs affected by the Middle East conflict, Sad accounted for 5.7% of reactions — the highest share of any topic we tracked in that study, well above flood control, cost of living, or general political content.
That number matters precisely because it’s rare. A high Sad share reliably signals genuine empathy and concern for people, not institutions or policies — a different emotional register entirely from the skepticism Haha represents.
😡 ANGRY — Direct Frustration
Angry is the most unambiguous negative reaction in the set — and our data shows it clustering specifically around cost-of-living and pocketbook issues. A single Facebook post about a ₱2,000 government cash aid announcement generated over 32,000 Angry reactions on its own — dwarfing the reaction counts on posts about flood control or institutional credibility during the same monitoring period.
Where Haha signals doubt and Sad signals concern, Angry signals direct, unambiguous frustration — usually tied to something with an immediate, personal financial impact.
🎯 HOW TO ACTUALLY USE THIS
A few practical takeaways that follow from comparing these studies side by side:
- The dominant reaction tells you the story, not the total engagement number. A viral post is not automatically a good outcome — check which reaction is actually driving the virality.
- Match the reaction to the content type. Love on entertainment content is expected. Love on a policy announcement is a genuine win. Haha on either is a very different story depending on which one it is.
- Rare reactions are often the most informative. Because Sad and Wow appear less frequently than Like or Haha, a spike in either is usually a stronger signal precisely because it’s unusual.
- Track reaction mix over time, not just once. A shift in which reaction dominates similar content, period over period, can reveal a change in public trust before comment-level sentiment analysis would catch it.
Frequently Asked Questions
Which reaction type is the strongest positive signal? Love, based on our data — it consistently dominates on content that generates genuine pride or admiration, such as SB19’s music milestones (83.5% Love) and the West Philippine Sea anniversary coverage (74.5% Love).
Is “Haha” ever actually a positive signal? On entertainment or lighthearted content, yes. On institutional, government, or economic content — which is where we’ve studied it most — it consistently signals skepticism or mockery rather than humor.
Why don’t you have data on the “Wow” reaction yet? It hasn’t been the dominant reaction in any of our published studies so far. It’s a gap we’re aware of and a good candidate for future research specifically on breaking-news or announcement-driven content.
How is this different from a generic “positive/negative” sentiment score? A binary sentiment score collapses Love, Like, Sad, and Haha into vague buckets. Reaction-level analysis keeps them separate — which matters, because Sad and Angry are both “negative” in a binary system but mean completely different things about what the public actually needs in response.
Is this the kind of analysis included in a Social Listening engagement? Yes — reaction-level breakdown is a standard part of our Social Listening Scan methodology. See our Social Listening Services →